Environmental Performance Data
Disclosing GHG data based on the GHG Protocol
NYK regularly receives an assurance statement from a third-party certifier confirming that NYK is reporting and disclosing accurate numerical values for greenhouse gas (GHG) emissions by NYK Group companies. This data is then used in calculations to confirm that NYK is meeting the framework of Scope 1, 2, and 3 of the GHG Protocol*1, a benchmark that NYK has achieved since 2012. NYK's certification was the first time in the maritime industry that data collection, calculation, and reporting had been confirmed by a third-party to be in line with Scope 3.
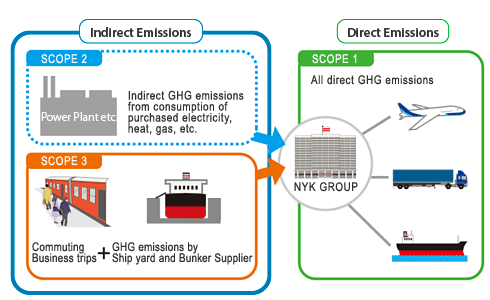
Scope1, 2 & 3 for NYK Group
- More Information:
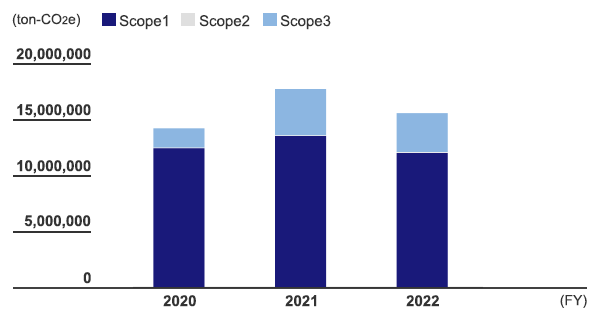
The NYK Group's GHG Emissions by Scope
| GHG-related Units: ton-CO2e | ||||
|---|---|---|---|---|
| Overall output | FY2020 | FY2021 | FY2022 | Ratio in FY2022 (%) |
| Scope1 | 11,650,054 | 12,678,695 | 11,255,044 | 77.1 |
| Scope2 | 49,444 | 45,391 | 76,255 | 0.5 |
| Scope1+2 | 11,699,499 | 12,724,086 | 11,331,299 | - |
| Scope3 | 1,623,678 | 3,890,661 | 3,264,023 | 22.4 |
| Scope1+2+3 | 13,323,177 | 16,614,748 | 14,595,322 | - |
Note 1: The scope of aggregation includes headquarters and consolidated subsidiaries.
Note 2: CO2e: CO2 equivalent
Note 3: GHG emission data for Scope 1, Scope 2, and Scope 3 has been verified by a third-party organization.
Verification Report (https://www.nyk.com/english/esg/envi/data/)
Note 4: For FY2021, we have partially reviewed the scope and revised the figures, certified after recalculation.
| Output breakdown | Sub category | FY2020 | FY2021 | FY2022 |
|---|---|---|---|---|
| Scope1 | Ships | 9,787,671 | 10,708,996 | 10,123,951 |
| Aircraft | 1,642,233 | 1,721,397 | 964,063 | |
| Others | 220,149 | 248,301 | 167,029 | |
| Scope2 - market basis | 49,444 | 45,391 | 76,255 | |
| Scope2 - location basis | 52,138 | 49,010 | 77,710 | |
| Scope3 | Category 1 | - | 1,887,367 | 1,486,233 |
| Category 2 | 99,013 | 255,143 | 197,887 | |
| Category 3 | 1,508,523 | 1,730,934 | 1,552,422 | |
| Category 5 | 15,489 | 16,379 | 19,827 | |
| Category 6 | 516 | 678 | 7,404 | |
| Category 7 | 135 | 157 | 247 |
Note 1: Scope 2 emissions are calculated on a market basis inside Japan and on a location basis overseas.
Note 2: In fiscal 2022, a renewable energy certificate was used to offset the electricity used at the Yokohama Branch (234,641kWh).
Note 3: For FY2021, we have partially reviewed the scope and revised the figures, certified after recalculation.
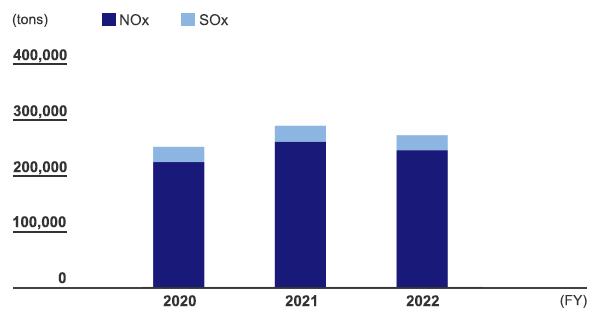
The NYK Group's NOx and SOx Emissions
| Other than GHGs | |||
|---|---|---|---|
| Output (from ships) | FY2020 | FY2021 | FY2022 |
| NOx | 209,925 | 243,726 | 229,722 |
| SOx | 25,518 | 26,970 | 25,216 |
Note : For FY2021, we have partially reviewed the scope and revised the figures, certified after recalculation.
The NYK Group's Energy and Resource Consumption Amounts
| GHG related | |||||
|---|---|---|---|---|---|
| Input breakdown | Sub category | Unit | FY2020 | FY2021 | FY2022 |
| Scope1 | Heavy oil A | Tons | 26,002 | 30,415 | 27,219 |
| Heavy oil C | Tons | 2,726,923 | 3,184,649 | 2,979,644 | |
| Gas oil (ships) | Tons | 153,324 | 159,484 | 173,779 | |
| LNG (ships) | Tons | 185,587 | 5,620 | 14,387 | |
| Jet fuel | KL | 666,877 | 699,024 | 391,486 | |
| Gasoline | KL | 49,187 | 71,860 | 9,058 | |
| Kerosene | KL | 51 | 52 | 49 | |
| Diesel | KL | 31,517 | 23,285 | 49,408 | |
| LPG | Tons | 449 | 511 | 375 | |
| Natural Gas | m3 | 9,757,385 | 8,624,448 | 7,460,194 | |
| Scope2-related | Electricity | MWh | 117,519 | 119,880 | 162,030 |
| Scope3-related | Waste (office) | Tons | 5,390 | 5,679 | 6,831 |
| Private power generation derived from renewable energies | Electricity | MWh | - | - | 5,970 |
Note 1: Electricity consumption in Japan is calculated on a market basis. CO2 emissions volume from electric power consumption for each fiscal year has been calculated using the coefficients for each electricity provider (actual figures for each fiscal year) published by Japan's Ministry of the Environment.
Note 2: For FY2021, we have partially reviewed the scope and revised the figures, certified after recalculation.
| Other than GHGs | ||||
|---|---|---|---|---|
| Input from offices | FY2020 | FY2021 | FY2022 | |
| Water | m3 | 446,656 | 292,510 | 863,697 |
| Paper | KG | 797,013 | 636,903 | 1,007,991 |
Obtaining Environmental Load Data from Domestic and Overseas Group Companies
Grasping the environmental burdens of energy consumption is a first step to reducing the burdens. We collect data on environmental burdens such as electricity usage, fuel consumption, industrial waste, and so on from domestic and overseas consolidated subsidiaries companies in an effort to comprehensively grasp the load situation throughout all our group companies and promote further reductions at the individual company level.
In fiscal 2017, we began using the Eco Track environmental load data collection/compilation system to obtain more efficient and accurate data.
Domestic
To better visualize our global environmental performance, we started collecting environmental performance data in January 2007 from major domestic consolidated group companies. As of March 2023, we collect 24 kinds of environmental performance data from 38 companies and 218 locations.
Overseas
In January 2008, we started collecting environmental performance data.
As of March 2023, 24 kinds of data, the same number being collected domestically, were being collected from 258 main overseas consolidated group workplaces. This network is not only a tool for collecting data but also a route for environmental communication. Moreover, we are continually working to improve the accuracy of all data.